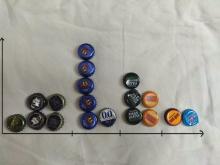
Some of you may have noticed my recent tweets with beer ratings. I am hopefully not developing a drinking habit, but this is rather part of a small personal data science project.
Although the tweets only contain my (or a friends’) name, the name of the beer, and an overall rating, the backend is slightly more complex. Using a few freely available tools I want to learn what my favorite beer is, what aspects of the beer determine my overall rating my beer taste (e.g., different aspects of taste, color, foam, label, cap, …), if this rating is stable over time, and if these evaluations are similar across multiple drinkers.
I use Google Sheets and Forms to collect the evaluation (on approximately 15 dimensions) , IFTTT to tweet about it (note: information to be tweeted has to be stored in the first few rows of the table), and Google Data Studio for the analysis and small dashboard.
I am still collecting responses so the analysis and definite results will have to wait. In the meantime, I am happy to receive suggestions which beers I might taste in the future. Also, contact me if you want to join.
- Log in to post comments